
How EUV Resist Blur and Dose-Induced Thinning Set the Stochastic Defectivity Floor

In this article, we will dive further into linking electron noise in EUV resists [1] to stochastic defectivity. In particular, it will be shown how the “floor” or the lower limit of a defect’s probability naturally comes about, when electron noise is combined with resist thinning with increasing dose [2]. We first review the probability for a 3 nm long, 4 nm wide defect (negative resist removed) located at the line edge, with 40 nm half-pitch for ArFi with a negative CAR resist, and 48, 40, 32, and 24 nm pitches for EUV with a metal oxide resist (Figure 1). The dose is 60 mJ/cm2 for the EUV metal oxide resist (MOR), and 30 mJ/cm2 for the ArFi chemically amplified resist (CAR). The resist thickness is taken to be equal to the pitch.
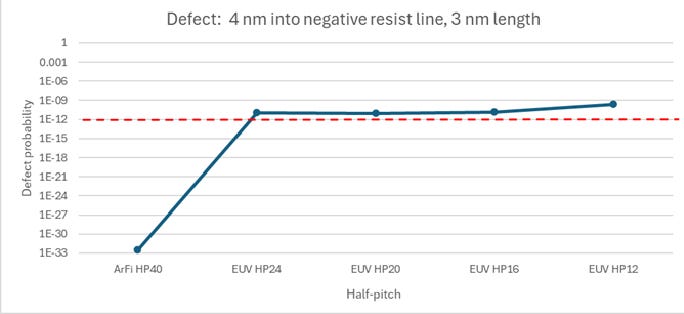
Figure 1. Defect probability for a 3 nm long, 4 nm wide negative resist line edge defect; conditions in Ref. [1]. 1e-12 corresponds to ~ 1/cm2 defect density [3].
A surprising finding is that the defect probability is actually lower for the 40 nm pitch than for the 48 nm pitch. The explanation for this is as follows. For these relatively large pitches (compared to the blur scale), the contrast reduction is quite minor (26% for 40 nm pitch, 19% for 48 nm pitch). In this case, the two-beam image slope at the edge is less flat for the smaller pitch. Consequently, moving away from the edge, the number of standard deviations away from threshold is larger for the smaller pitch (Figure 2).
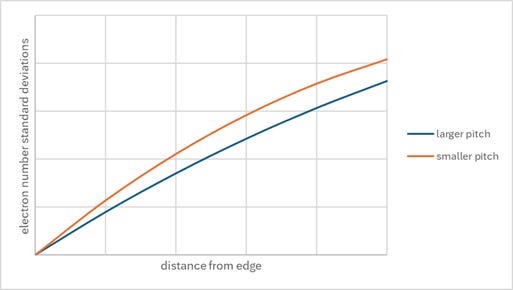
Figure 2. The number of standard deviations of electron number away from threshold increases faster for the smaller pitch. In this situation, where the blur does not significantly degrade the contrast of the smaller pitch, the defect probability would be lower for the smaller pitch.
Going below 40 nm pitch, the blur starts to degrade the contrast more significantly. The effect of reduced contrast from blur (at a given pitch) is shown in Figure 3.
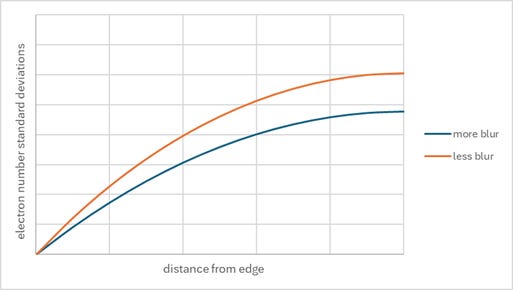
Figure 3. The number of standard deviations of electron number away from threshold increases faster when there is less blur, leading to a lower defect probability.
Thus, the combination of these two conflicting trends leads to a defect probability floor as far as pitch is concerned.
There are two ways to lower the floor to lower defect probabilities. One is to reduce the blur (Figure 4).
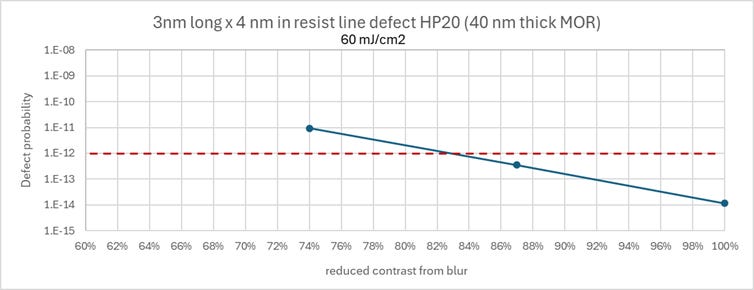
Figure 4. Blur reduction can reduce defect probability. It is generally not possible to get to the no blur case (100%).
However, there are many sources of blur: electrons, polarization, acid diffusion, defocus, image fading. Some of these sources depend completely on the resist, while others are purely optical. It will be impossible to completely eliminate the blur. The electron blur itself is not a constant [4].
The other way to reduce the defect probability would be to increase the dose, in order to reduce the standard deviation of the electron number relative to the average [1]. The dose has to be over 74 mJ/cm2 for the 40 nm pitch MOR case (Figure 5).
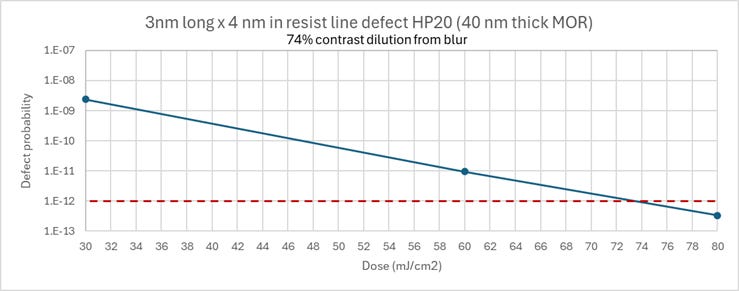
Figure 5. Increasing the dose reduces the electron noise, which is another way to reduce the defect probability.
Increasing the dose would seem to be the sure way to sufficiently suppress the defect probability, were it not for the resulting degradation of the resist itself [2]. Using a Poisson model, we could expect the pinhole defect probability to be exponentially dependent on the thickness t, i.e., P(pinhole) ~ exp (-a*t). The thickness lost, in turn is, at least roughly, proportional to the dose [2, 5], i.e., P(pinhole) ~ exp (c * dose). This probability would be added to the electron noise defectivity probability: P(defect) = P (electron exposure error) + [1-P(electron exposure error)] * P(pinhole) ~ P (electron exposure error) + P(pinhole). This is visualized in Figure 6. The particular dependence of the pinhole defect probability was chosen to give a minimum defectivity dose of ~60 mJ/cm2, comparable to the results of Ref. [6].
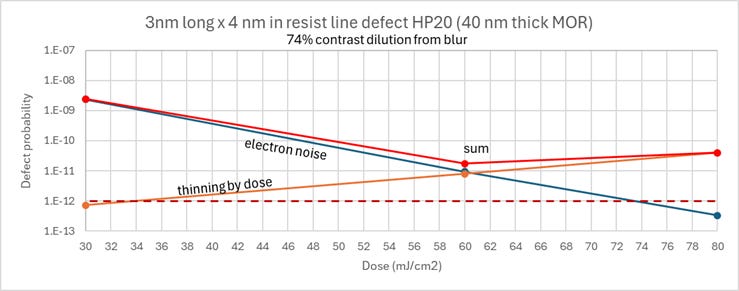
Figure 6. The probability of defectivity from resist degradation at higher doses (orange) is added to the probability of electron exposure error from Figure 5 (blue). The sum (red) shows a minimum at 60 mJ/cm2 for this case.
We see that the conflicting trends of resist thinning and electron noise with increasing dose is another mechanism for providing a defect probability floor, this time with respect to dose. Shifting the resist thinning curve to lower defect probabilities pushes the minimum defectivity dose higher, an outcome which is not desired by EUV users [6].
Moreover, some defects do not show up after the resist is developed, but after it is etched [7]. This is an indication that the defectivity shows up in the resist density fluctuations, only detectable by the particular etch chemistry. The results were also worse for thinner resists, consistent with the Poisson model.
References
[1] F. Chen, Revisiting Electron Noise in EUV Lithography: It’s Pseudo-Poissonian After All!, Exposing EUV.
[2] F. Chen, EUV Resist Degradation with Outgassing at Higher Doses, Exposing EUV.
[3] P. Bisschop, “Stochastic effects in EUV lithography: random, local CD variability, and printing failures,” J. Micro/Nanolith. MEMS MOEMS 16, 041013 (2017).
[4] F. Chen, Impact of Varying Electron Blur and Yield on Stochastic Fluctuations in EUV Resist, Exposing EUV.
[5] O. Kostko et al., “Extreme ultraviolet induced chemistry in polymer thin films,” Proc. SPIE 13428, 134282K (2025).
[6] J. Lee et al., “EUV DRAM Patterning Historic Overview and Future Assumption,” Proc. SPIE 13425, 134250V (2025).
[7] A. Thiam et al., “Towards high NA patterning readiness: Materials, processes and etch transfer for P24 Line Space,” Proc. SPIE 11854, 118540A (2021).
More good to know stuff Fred. Thanks for sharing bud.
I would like to point out a difference in assumptions between this article and an earlier one (Resist Loss Model for the EUV Stochastic Defectivity Cliffs) with a similar outcome: https://frederickchen.substack.com/p/resist-loss-model-for-the-euv-stochastic. In the earlier article, the EUV-induced hydrogen plasma was assumed to be the cause of the resist thinning, so threshold changes with remaining thickness. However, in this one, the resist degradation from the dose itself is taken to be the key cause, as more recent publications show this even in the absence of the hydrogen plasma: https://frederickchen.substack.com/p/euv-resist-degradation-with-outgassing.